⛳ Cordeiro is situated in or near the subtropical moist forest biome.
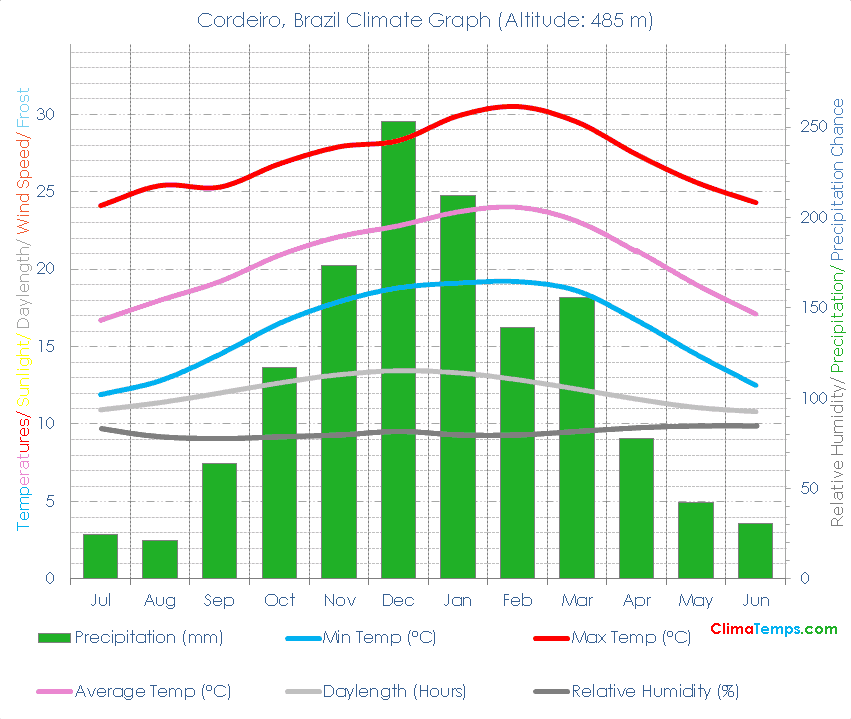
🌡️ The mean temperature is 20.6 degrees Celsius (69.1 degrees Fahrenheit). See the temperatures page for a monthly breakdown and the fixed scale graph.
🐬 Average monthly temperatures vary by 7.3 °C (13.1°F). This indicates that the continentality type is hyperoceanic, subtype barely hyperoceanic.
☔ Total annual precipitation averages 1309.8 mm (51.6 inches) which is equivalent to 1309.8 Litres/m² (32.13 Gallons/ft²).
Simply paste the following HTML code into your webpage. Please include a link back to this website. There is one in the following code already. Edit the width attribute to change the size of the graph if needed:
In the winter time records indicate temperatures by day reach 24.6°C (76.3°F) on average falling to 12.4°C (54.3°F) overnight.
In spring time temperatures climb reaching 26.7°C (80°F) generally in the afternoon with overnight lows of 16.3°C (61.3°F).
During summer average high temperatures are 29.6°C (85.2°F) and average low temperatures are 19°C (66.3°F).
Come autumn/ fall temperatures decrease achieving average highs of 27.5°C (81.5°F) during the day and lows of 16.6°C (61.9°F) generally shortly after sunrise.
✨ The longest day of the year is 13:20 long on the 21 of December and the shortest day is 10:39 long on the 22 of June.
🐇Were you to burrow down through the centre of the Earth from Cordeiro you would pop up nearest to the climate station at Chichijima, Japan.
🌍Cordeiro, Brazil is at 22°2'S, 42°22'W, 485 m (1591 ft). Check the location on the map.
| Climate Variable | Jul | Aug | Sep | Oct | Nov | Dec | Jan | Feb | Mar | Apr | May | Jun | Annual | ||
|---|---|---|---|---|---|---|---|---|---|---|---|---|---|---|---|
| Average Max Temperature °C ( °F) | 24 (75) | 25 (78) | 25 (78) | 27 (80) | 28 (82) | 28 (83) | 30 (86) | 31 (87) | 30 (85) | 27 (81) | 26 (78) | 24 (76) | 27 (81) | ||
| Average Temperature °C ( °F) | 17 (62) | 18 (64) | 19 (67) | 21 (70) | 22 (72) | 23 (73) | 24 (75) | 24 (75) | 23 (74) | 21 (70) | 19 (66) | 17 (63) | 21 (69) | ||
| Average Min Temperature °C ( °F) | 12 (53) | 13 (55) | 15 (58) | 17 (62) | 18 (64) | 19 (66) | 19 (66) | 19 (67) | 19 (65) | 17 (62) | 15 (58) | 13 (55) | 16 (61) | ||
| Average Precipitation mm (in) | 25 (1) | 21 (1) | 64 (3) | 117 (5) | 173 (7) | 253 (10) | 212 (8) | 139 (5) | 156 (6) | 78 (3) | 42 (2) | 31 (1) | 1310 (52) | ||
| Average Daylight Hours/ Day | 10h 55' | 11h 23' | 12h 00' | 12h 39' | 13h 11' | 13h 26' | 13h 18' | 12h 51' | 12h 15' | 11h 36' | 11h 04' | 10h 48' | 12h 00' | ||
| Sun altitude at solar noon on the 21st day (°). | 47.6 | 56 | 67.3 | 78.2 | 86.1 | 88.5 | 86.6 | 78 | 67.5 | 56 | 47.7 | 44.5 | 67 |
Please take a moment to share a climate graph or simply the address:
Thank You, so much! ❤️